High quality graphics for your Latex document: The Matlab route
December 8, 2016
You use LaTeX instead of a WYSIWYG word processing program because they can’t cope with the high quality required for publication. But your nice professional looking documents can be ruined because you insert the wrong type of figures. Bitmap figures are easily pixelated because the actual size is not always known beforehand. Exporting figures as PDF to be included sounds like a good idea but you’ll quickly notice the problem with the text (e.g. axis label and ticks,…) which needs to be rendered by Latex to get the correct font and size. Hard-core Tex users can find the answer to this problem in Tikz or Pgfplot. Of course figures generated at this level is as good as it gets. I use Tikz picture quite frequently for text-heavy diagrams and simple plots. However, if the figure is moderately complicated or if it’s bound to precise data, then generating figures this way quickly becomes unmanageable.
Matlab comes to the rescue
An alternative solution is to draw the plots in Matlab/Python (with matplotlib) and export it in a format that can be included in Latex with the text part of the figure stored separately. Matlab does not support this natively but there are lots of community scripts capable of doing so. Below are a few that I have tried (to my knowledge, I have tried all of them):
Matlab2Tikz: This script will convert Matlab plots to Tikz/PGFPlot figures which can be
\input{}directly into your Tex document. Basically it writes the Tikz commands for you. The catch is that it can’t deal with plots that have pixelated images, and not all types of plots can be converted. In my experience, this tools only works with simple plots. Try it with anything more than just a few curves and the generated file will likely to cause all sort of weird errors.Matfig2PGF: Same idea as Matlab2Tikz but it generates PGF code instead. PGF is a lower level language than Tikz, so the generated file is usually quite big. It can blow out of 5000 lines easily even for mildly complicated figures. This might render your Tex editor out of memory. It also can’t deal with pictures.
Matlabfrag: This toll will generate two files, one EPS containing non-text part and one TEX file containing the text. Then you can use PsFrag to render the text and overlay it on top of the EPS file. This is one of the first complete solution I found, since the part that generates EPS file is actually a Matlab routine, so there should be no error to expect. However, PsFrag is notoriously difficult to handle, because it requires
--shell-escapeto be enabled to call a external routine for generating figures. The smallest changes to your environment will result in an error. I once wasted a whole day bashing my head against the monitor because the same document that had rendered a day before now resulted in an error. I later found out that the shell it escape to issh(not evenBash), and for some reason thePATHvariable was not loaded, preventing it from calling its external routines. Also, PsFrag requires Pd f LaTeX to function, so XƎTeX will not work. Your only option if you want to use True Type Face fonts is Lu a LaTeX, in theory - because it didn’t work for me. So I eventually ditched this option.Laprint This is very similar to Matlabfrag except that it requires more parameters to be passed into. They have the exact same pros and cons.
Plot2LaTeX So far this is the best option and I’ve been using this tool for a long time. It’s also based on the idea of exporting text and non-text separately, then typeset the text on top of the figure. But that part is done using Inkscape. The tool simply export a SVG file using Matlab’s built-in routine, then call inkscape to convert the SVG file to a PDF, which is purely graphic, and a
pdf_texfile containing instructions to overlay that PDF with text. What’s nice about it is that the SVG file is modifiable by inkscape. Sometimes the graph needs very minor modifications which might be difficult with Matlab (for example: convert the axes into arrows), but effortlessly doable in Inkscape. Detailed workflow for using Plot2LaTeX is presented below.
Matlab to LaTeX via Plot2LaTeX
The workflow is simple, you just need to install Plot2LaTeX and Inkscape once, then:
Summary of steps:
- Plot in Matlab
- Export with
Plot2Latex()command- If necessary: modify in Inkscape and save as
.pdf_tex- Import into LaTeX
Let’s break it down:
0. Installation
Google will let you know where to download the latest version of Plot2Latex and Inkscape. On Mac, Inkscape requires XQuartz because it’s built on XWindow. There’s also a separate branch built on osxmenu which can run natively on Mac. There hasn’t been any official release and the development seems to have stopped since May 2015 (last version was based on r12922). However it’s stable enough for me (using OSX El Capitan) to recommend it. An executable can be downloaded from here.
Plot2Latex will call Inkscape so it is necessary to provide the tool with the correct path to inkscape. Search for the line beginning with DIR_INKSC = and modify it, e.g.:
DIR_INKSC = '/Applications/Inkscape.app/Contents/MacOS/inkscape';
1. Plot in Matlab
You can seriously go nuts! Bring it on any sort of plot you can think of. The routine eventually call Matlab’s saveas() so as long as the MathWork guys don’t mess it up, any plot should be savable. It’s also possible to use Latex as the renderer for your strings.
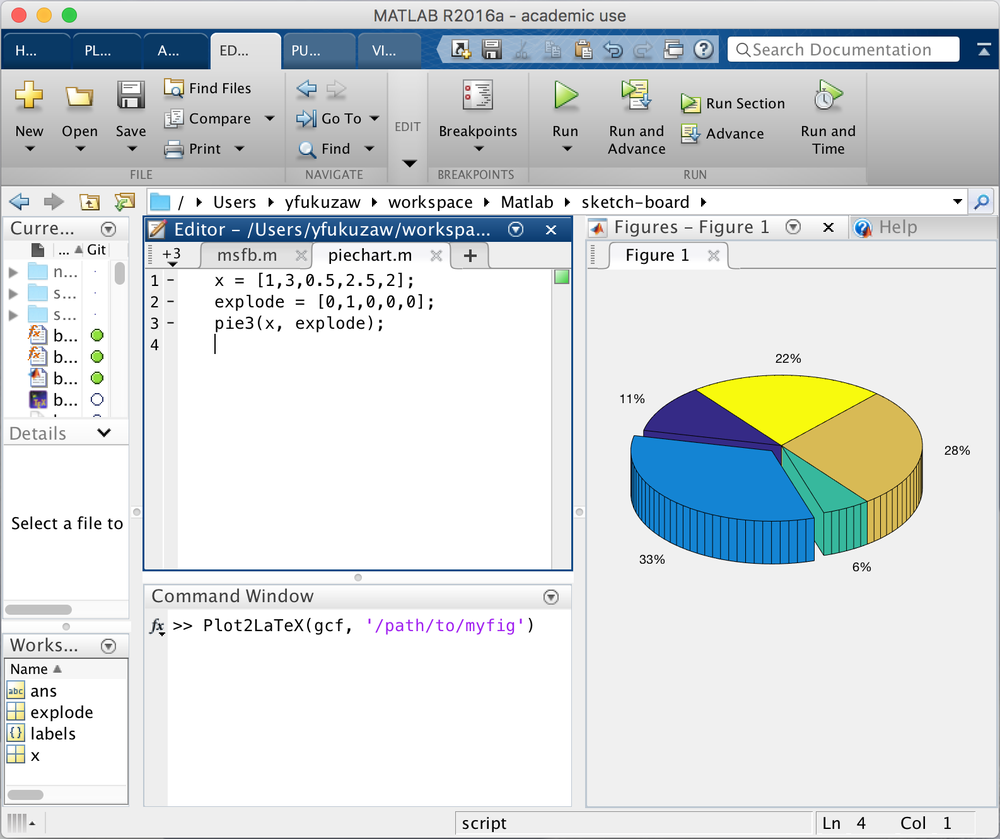
2. Export with Plot2Latex
Once you’re happy with the plot, you can export it with the following command:
Plot2LaTeX(gcf, '/path/to/tex/figures/my_figure')
This will generates my_figure.svg, my_figure.pdf and my_figure.pdf_tex in folder /path/to/tex/figures. It is possible to use the .pdf_tex file right at this stage, but you might want to modify it a bit, at least to get rid of the empty margin surrounding the figures.
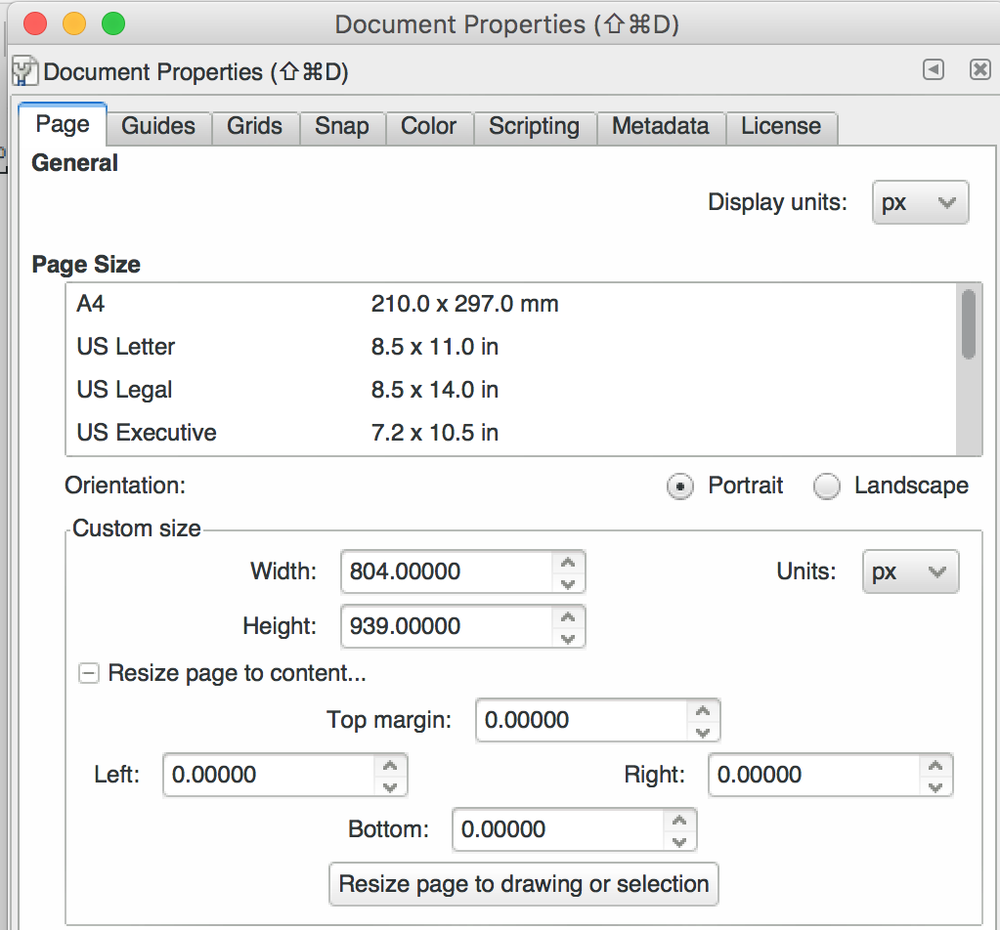
3. Modify in Inkscape
Open the SVG file with Inkscape. You’ll need to get used to a few Inkscape commands but in general it’s not that different from other image processing program. You’ll need to get rid of several blank layers that span the whole page before you can modify anything. You can get Inkscape to automatically shrink the page to fit the actual figure, removing all white margin. And you can do that by clicking File -> Document Properties (Keyboard shortcut: ⇧⌘D), expand Resize page to content..., then click on Resize page to drawing or selection.
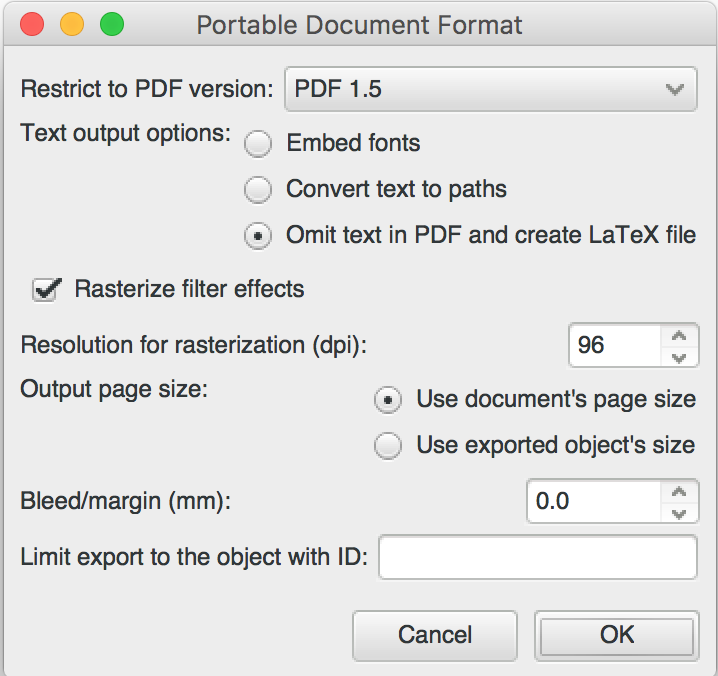
Now you can save the changes to .pdf_tex by selecting File -> Save as (Keyboard shortcut: ⇧⌘S), choose PDF, select Omit text in PDF and create LaTeX file. Now you’re ready to import the figure into LaTeX
4. Import into LaTeX
The .pdf_tex file is nothing but a piece of TEX code, so you would import it into LaTeX using \input{} as following
\usepackage{graphicx}
\graphicspath{{./figures/}}

\begin{document}
...
\begin{figure}
  \footnotesize
  \def\svgwidth{.7\linewidth}
  \input{figures/my_figure.pdf_tex}
\end{figure}
...
\end{document}
Explain:
\graphicspath{{./figures/}}You will need this because the.pdf_texfile will import the PDF file without fully qualified path. This is to tell it to find any PDF files infigures/folder.
\footnotesizeSet the size of text elements to footnotesize.
\def\svgwidth{.7\linewidth}Set the overall width of the figure to be 0.7 the line’s width.
Result:
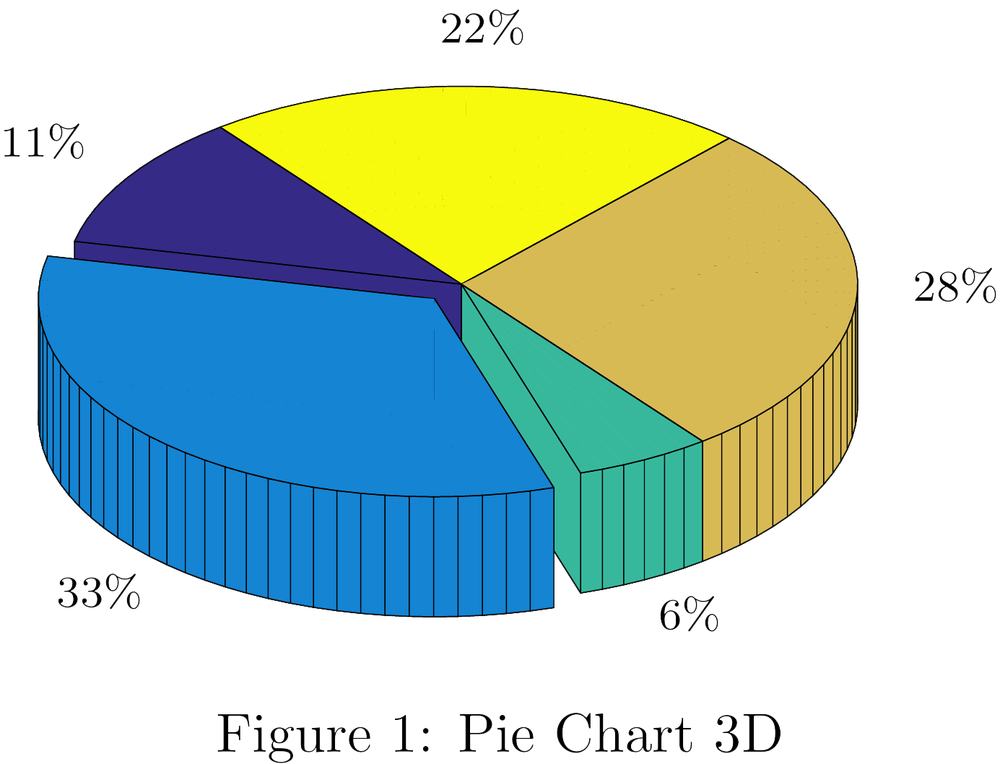
You can notice that the figure looks infinitely sharp and the text is typeset using the right font and size.
Some existing problems
There are two known problems, both belong to Inkscape. It might have well been fixed in earlier versions of Inkscape but since I prefer the osxmenu version, I’m stuck with these bugs. I’m listing them out here together with the solutions, in case you bump into one:
Messy PDF pages Ideally all graphic elements should be on one page, but for some reason, sometimes Inkscape decides to draw them separately on different pages, then instruct LaTeX to layout them on top of each other, such as:
\put(0,0){\includegraphics[width=\unitlength,page=1]{myfig.pdf}}
...
\put(0,0){\includegraphics[width=\unitlength,page=2]{myfig.pdf}}
But the real problem comes from the generated
.pdf_tex, most of the time the pages are off by 1, e.g. if the element is on page 3, the instruction will be to draw page 4. This will lead to error when the last page is drawn because the index is 1 more than the maximum. You will need to manually modify the page numbers to fix the problem.Most of the time, there will be a single-page PDF, but the
.pdf_texwill import it twice, with the second time referring to page 2. In this case, simply remove the duplicate.Percentage sign
%is the beginning of a comment in LaTeX, so if your plot has strings with a comment sign, it will be used without escaping in the.pdf_texfile. This will obviously lead to invalid syntax. Again, manual modification is required to fix it. You can also modifyPlot2LaTeX.mto automatically escaping%before rendering the SVG file as following:function strXML = EscapeXML(str) % ESCAPEXML repaces special characters(<,>,',",&) -> (<,>,',",&) escChar = {'&','<','>','''','"','%'}; repChar = {'&','<','>',''','"','\\%'}; strXML = regexprep(str,escChar,repChar); end
Why use Plot2LaTeX just to get the SVG file
You might have realised that it doesn’t seem necessary to use Plot2LaTeX, if we only care about the SVG, and the .pdf_tex part is generated manually with Inkscape. Can we export the figure directly to SVG using saveas()? Certainly, in some cases it might work. Problems arise when the plot has axes. All the ticks on an axis will be rendered as one long string, with single tick no longer binds to a data point. So when the figure is rendered in LaTex, the axis ticks will squash together. We need Plot2LaTeX to first separate the tick labels and bind them to the exact data point on the axes. This way no matter what font and size is used, the axis will always be rendered correctly.
If you like this post, please consider sharing with , , , , or leave me a comment below.